
Custom Dashboards: What Are They and Why Your Business Needs One
- salmaakter2441990
- Oct 2, 2025
- 3 min read
Many small and medium-sized businesses juggle spreadsheets, bank portals, and accounting reports. The real challenge isn’t gathering numbers—it’s making them easy to understand and act on.
A custom dashboard is a simple, visual snapshot of the numbers that matter most to your business—shown on one screen, updated automatically, and organized in plain language. It pulls from the tools you already use (for example, QuickBooks or Xero, bank feeds, and payment processors) so you can see cash, sales, expenses, and profit at a glance.
In short, a good dashboard turns scattered data into calm, clear insight.
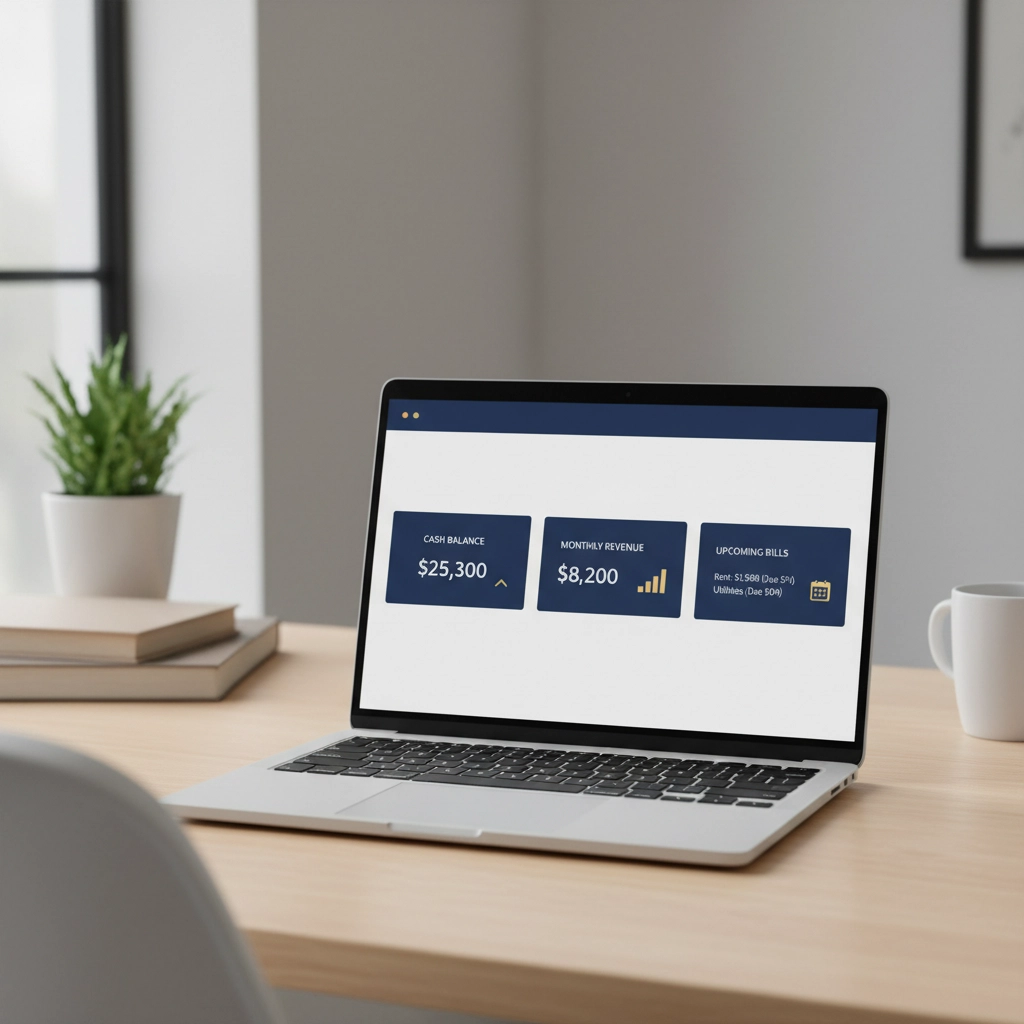
What Is a Custom Dashboard?
A custom dashboard is a one-page home base for your business finances. It shows your key metrics in charts and cards—think “Cash today,” “Sales this month,” “Bills due,” and “Profit margin.” No digging through reports. No exporting and reformatting spreadsheets.
It’s tailored to your business model and goals.
It updates on a schedule (daily or weekly) so you’re never working from stale data.
It highlights trends and exceptions so you can act quickly, not just look back.
In short, it’s the fastest way to see how the business is doing right now.
Why It Matters for Small and Medium Businesses
Custom dashboards help owners and teams make better decisions with less stress.
Clarity at a glance: See cash balance, incoming revenue, and upcoming bills without opening five tabs.
Faster decisions: Spot an expense spike or soft sales week and adjust immediately.
Fewer surprises: Simple alerts or color cues make it obvious when something needs attention.
Time saved: Less manual reporting means more time for customers, sales, and operations.
Shared understanding: A single, consistent view keeps owners, managers, and bookkeepers aligned.
Confidence with lenders and advisors: Clean visuals make conversations with banks, CPAs, and investors straightforward.
For example, if operating expenses rise 12% this month, a dashboard makes that visible early—before it becomes a cash flow problem.
What a Good Dashboard Shows (No Jargon)
Dashboards work best when they keep to the essentials:
Cash on hand and runway: Today’s balance and how many weeks of expenses it covers.
Sales and revenue trend: This month versus last month and the same month last year.
Bills and invoices: What’s due soon, what’s overdue, and from whom.
Top expenses: The few categories driving most of your spend.
Profit snapshot: Gross margin and net profit in simple terms.
Simple forecast: A light view of expected cash in and out for the next few weeks.
In short, it answers: Do we have enough cash, are sales on track, and where is the money going?
How Dashboards Simplify Bookkeeping
Dashboards don’t replace bookkeeping—they make it easier and more consistent.
Fewer repeat questions: Owners see answers instantly (“What’s our cash?” “Who still owes us?”).
Consistent categories: Clear views encourage tidy books and reduce miscoded transactions.
Less manual work: Automated feeds mean fewer exports, merges, and spreadsheet versions.
Faster month-end: Real-time checks during the month lead to a smoother close.
Audit-ready history: Trends and notes live in one place, so reviews with your CPA are simpler.
In short, a dashboard keeps daily visibility high and keeps the books clean.
Practical Examples
Service business: Utilization drops for two weeks. The dashboard shows lower billable hours and a dip in gross margin, prompting schedule adjustments before month-end.
E-commerce shop: Ad spend rises but conversion falls. The dashboard flags CAC increasing while revenue per order stays flat, so the owner pauses one campaign and shifts budget.
Agency: Accounts receivable days creep up. The AR widget highlights overdue invoices, leading to quicker follow-ups and improved cash flow.
Each example shows the same pattern: quick visibility, quick action, better results.
Keep It Simple to Get Started
A dashboard should be easy to read and easy to maintain.
Choose the five numbers you check most often and put them on one page.
Pull from the systems you already trust (accounting, bank, payments).
Update on a schedule—weekly works for most small businesses.
Use clear labels and simple visuals; avoid crowded charts and tiny text.
Share the view with your team so everyone stays aligned.
In short, start small, keep it visible, and build only when a new metric earns its place.
The Bottom Line
A custom dashboard gives owners a clear view, faster decisions, and fewer surprises. It helps teams focus on what matters and reduces the mental load of toggling between tools. If you want to feel more in control of your business—without adding more reports—a simple, well-designed dashboard is one of the most effective tools you can adopt.
If you’d like support building a clear, reliable dashboard from clean books, Brightly Bookkeeping can help. We organize the data, streamline the view, and keep it current—so you can make confident decisions with less effort.